
Charts are powerful tools for presenting data and communicating information effectively. In ActiveCalculator, you can use various types of charts to display values over time, compare categories, or show the composition of a whole. Our platform supports a range of chart types, including line charts for showing trends, bar charts for comparing categories, and pie charts for displaying the composition of a whole.
Adding a charts question to your calculator
To add a Charts question to your calculator, follow these steps:
-
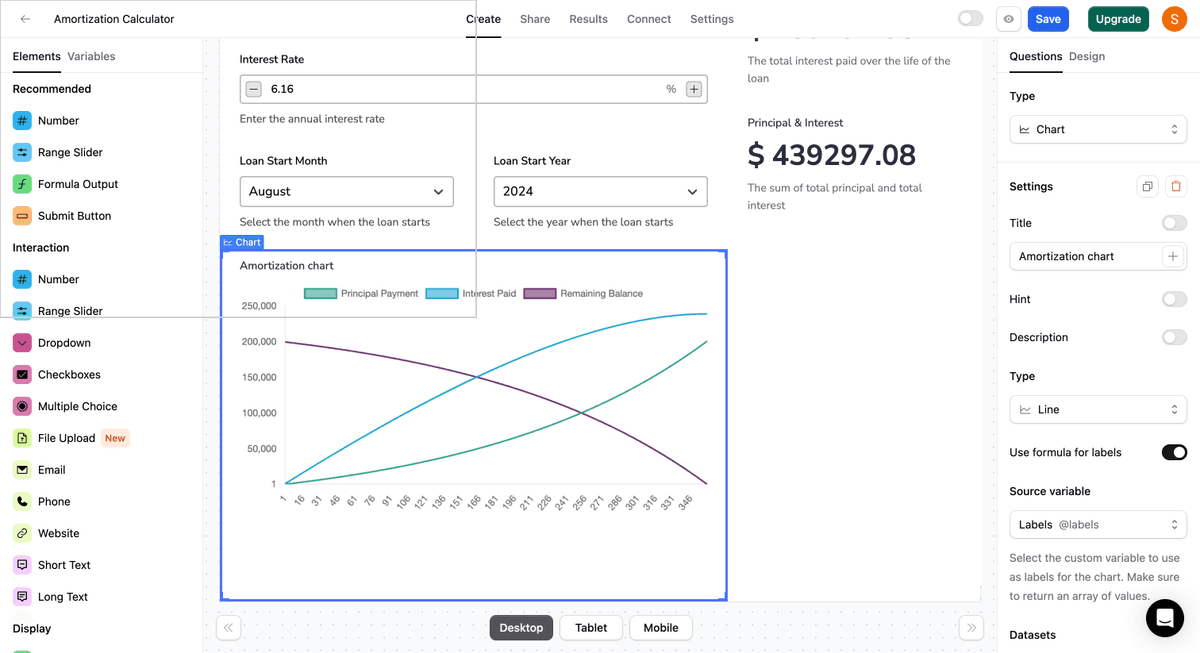
Click on the Charts question in the calculator editor to add it to your form. Note: The chart will include placeholder data for the horizontal axis labels and the dataset. Please clear this data before proceeding to build your chart.
-
Click on the newly added Charts question in the editor to open the right sidebar settings.
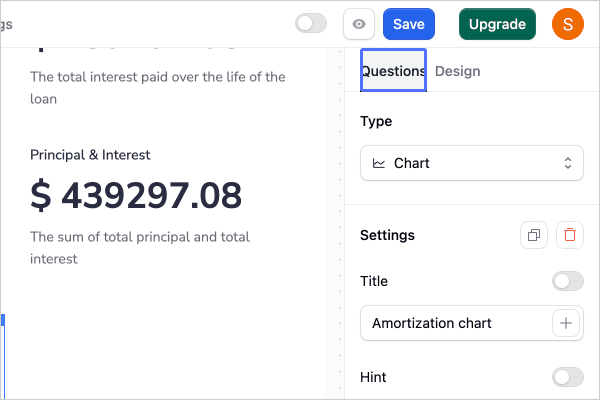
- In the right sidebar, click on the "Settings" tab to access the Charts Settings Options.
Customizing charts settings
Once you've added the Charts question, you can customize its settings to fit your specific requirements:
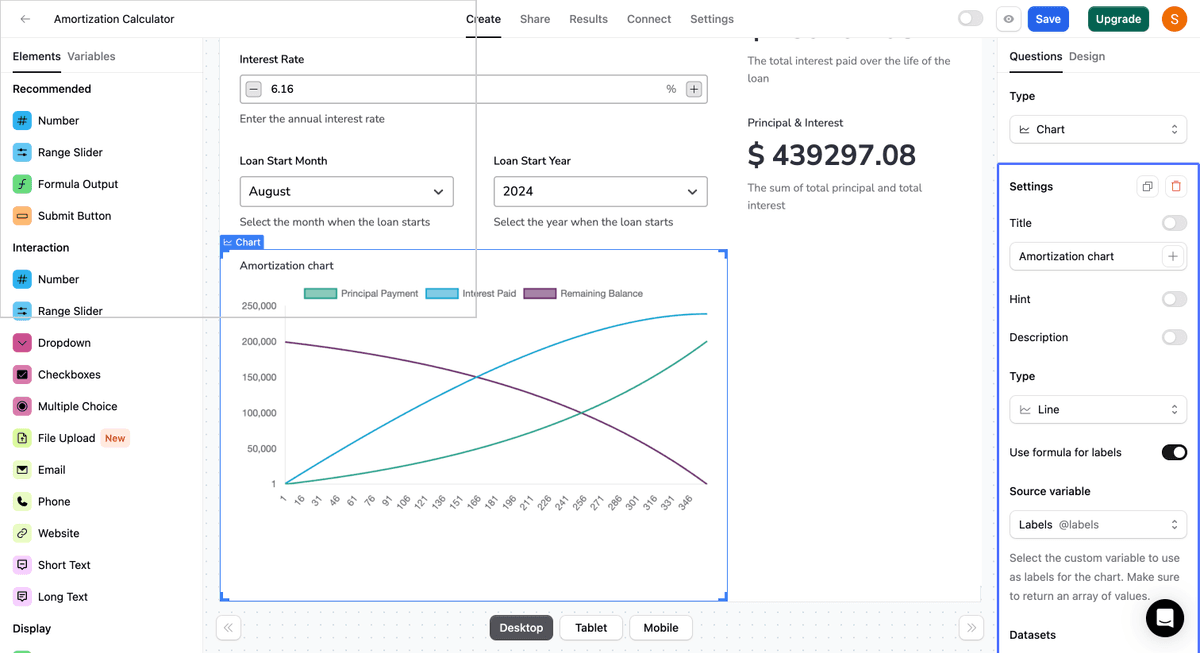
Title, hint, and description
-
Title: Provide a clear and concise title for the Charts question. You can also include variables in the title by clicking the PLUS button on the right side of the title settings. For example, type the @ key on your keyboard, then select which answer you'd like to insert into the question.
-
Hint: Add a hint to provide more context or explain what information the chart conveys. The hint appears as a small info icon next to the question title.
-
Description: Include a more detailed description below the title to give users additional information about the chart. You can also incorporate variables in the description using the PLUS button on the right side of the description settings.
Chart types
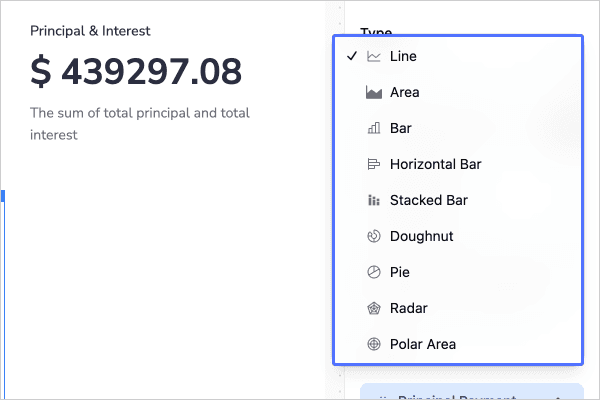
ActiveCalculator supports the following chart types:
- Line: Show trends over time
- Bar: Compare different categories
- Stacked Bar: Compare categories with multiple sub-categories
- Horizontal Bar: Compare categories horizontally
- Area: Show the composition of a whole over time
- Donut: Display the composition of a whole
- Radar: Compare multiple variables
- Pie: Show the composition of a whole
Choose the chart type that best suits your use case. You can switch between chart types at any time.
Adding labels
-
Vertical axis labels: The labels for the vertical axis are set automatically. You can update the minimum and maximum y-axis scale, and the y-axis step size in the 'settings'. You can also choose to hide the vertical labels from this panel.
-
Horizontal axis labels: The horizontal x-axis labels are optional. You can set them via the panel by adding (click on Add Label) and naming labels or via a formula. Using a formula for your labels is an advanced option that provides more flexibility for setting the labels. You should choose this option when the number of data points depends on a configuration in your calculator.
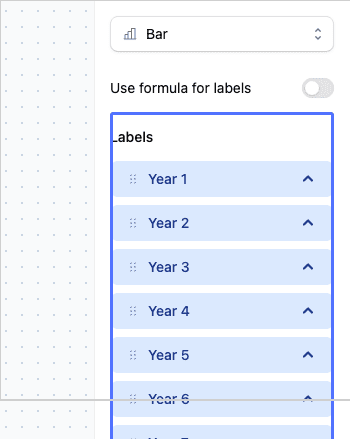
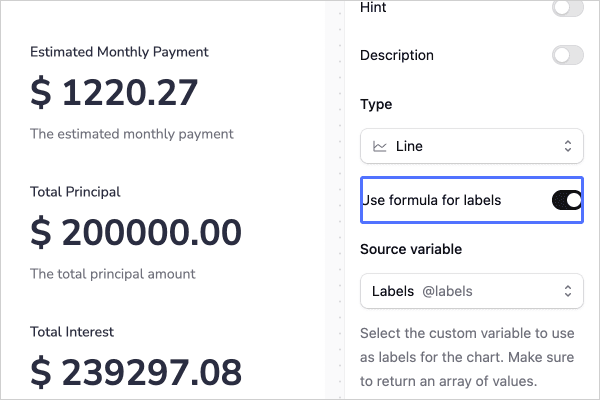
- Using formulas for labels: To add a label formula, toggle the option 'Use Formula for Labels' and select the custom variable to use as labels for the chart. Make sure to return an array of values. If you don't have a variable containing your labels, you can add a new custom variable.
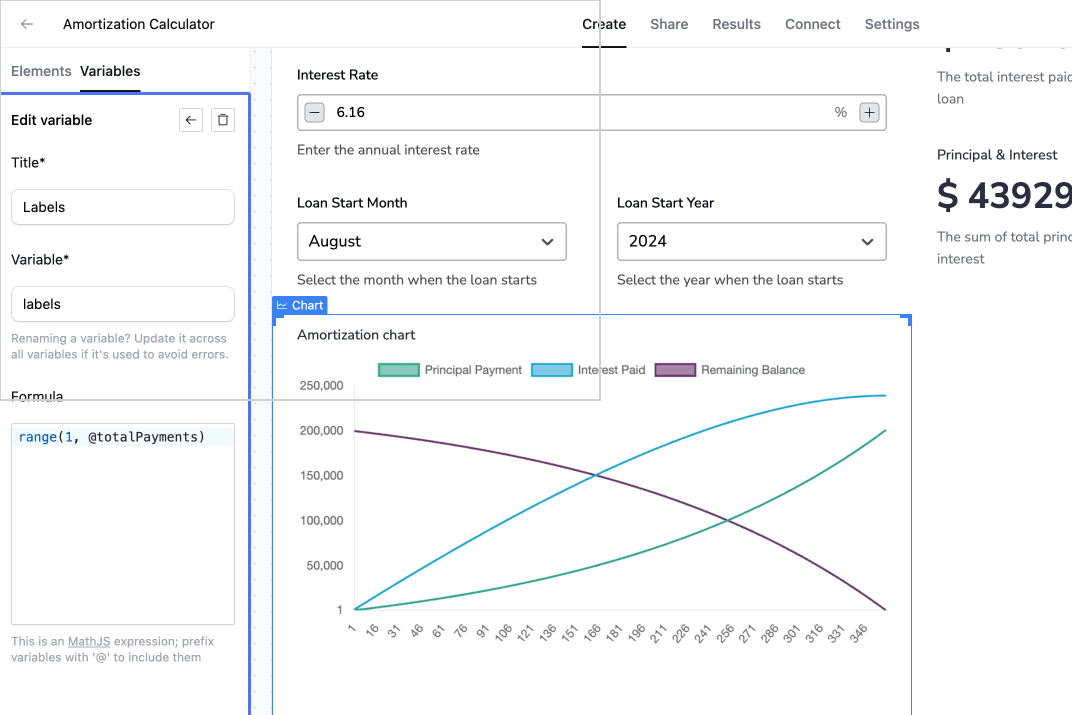
Here's an example of a formula you can use to create horizontal labels:
range(1, @totalPayments)If you're building a loan calculator and want the labels to display the separate years in the loan term, where the loan term is set by the question QA, this function will output an array/list (1, 2, 3, 4, 5, 6, 7, 8, 9, 10, ..., 360) when the loan term is set to 30 years (totalPayments=30).
totalPayments is another custom variable we created with the formula @loanTerm (loan term in year) * 12.
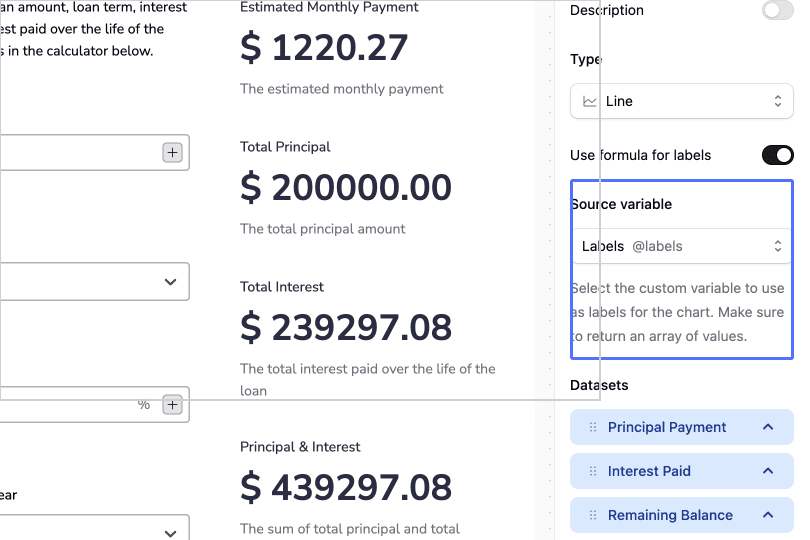
For comprehensive instructions on using custom variables in your calculations, please visit our detailed guide on custom variables.
Building a dataset
In ActiveCalculator, you can create a dataset using custom and built-in functions. The formula outputs will provide you with a list of results. For example:
The combination of the following built-in and custom functions:
f(x) = x * 10
map([1,2,3,4,5,6], f)
will give the output [10, 20, 30, 40, 50, 60], which can be used as data for a chart. The function consists of three parts:
- MAP: The MAP function repeats the custom function (3) for each value in the array (2). The output of the MAP function is a new array with the changed values.
- ARRAY: The array contains values that will be used in the custom function (3). The values in the array will replace x in the custom function.
- Custom Function: This simple function
x * 10will be repeated for each value in the array (2) via the MAP function (1).
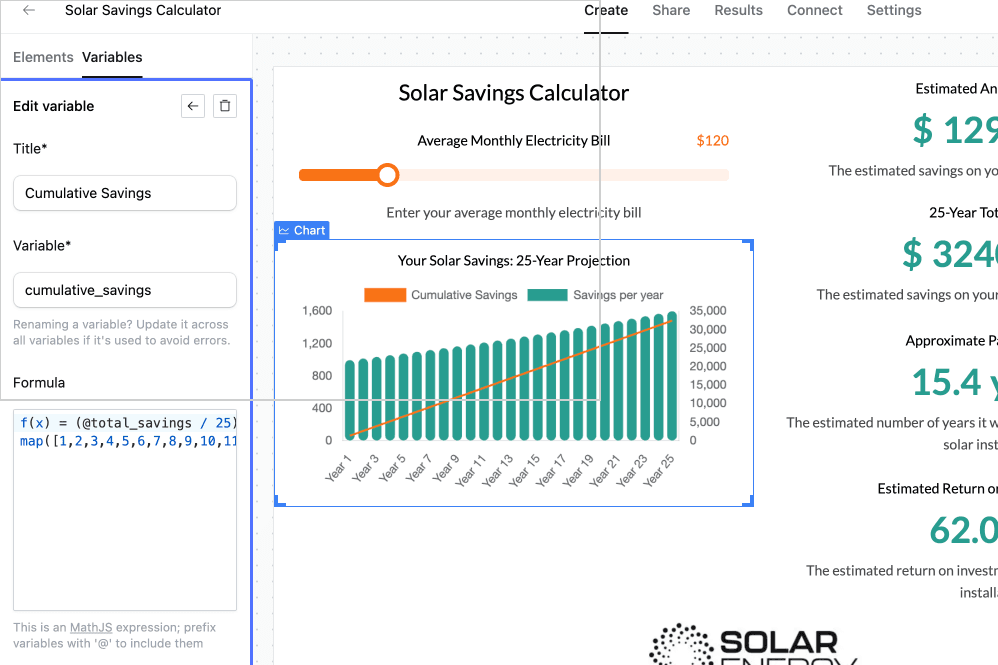
Here's a more complex example using the above steps for a solar savings calculator:
average_annual_savings = @total_savings / 25
growth_factor = 1.02
first_year_savings = (average_annual_savings * 2) / (growth_factor^24 + 1)
f(x) = first_year_savings * (growth_factor^(x-1))
map([1,2,3,4,5,6,7,8,9,10,11,12,13,14,15,16,17,18,19,20,21,22,23,24,25], f)
Applying dynamic dataset formulas to charts
To use your dynamic dataset formula and apply it to charts:
- In the left sidebar panel, go to the "Variable" tab.
- Add a new custom variable.
- Paste your dynamic dataset formula and name your custom variable.
- Save the calculator changes.
Now, in the right sidebar settings panel, under "Datasets":
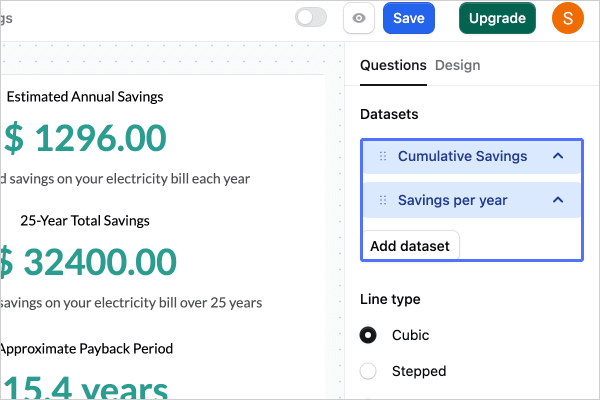
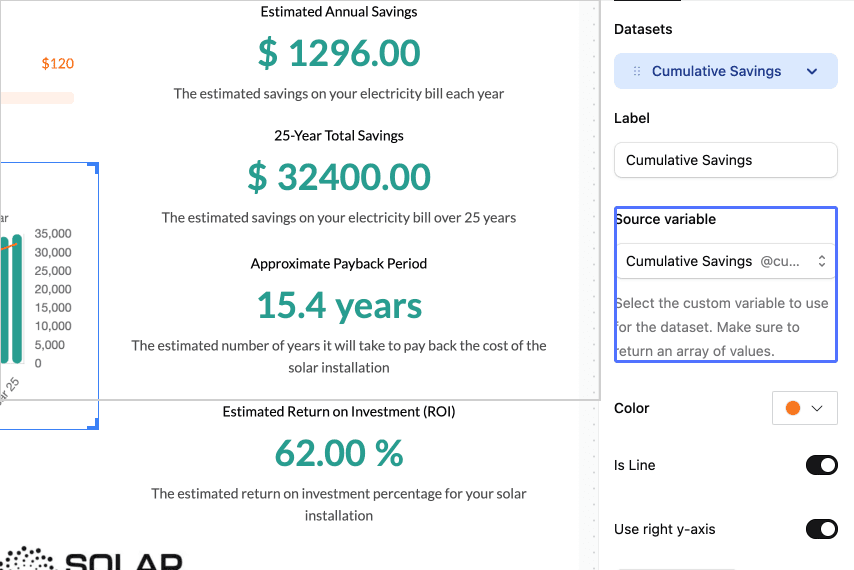
- Select the custom variable to use for the dataset. Make sure to return an array of values.
- Change the color of your datasets.
- Enable "Use right y-axis" for your dataset if needed.
- Toggle "Is Line" in some chart types (e.g., bar chart) to convert bars to lines.
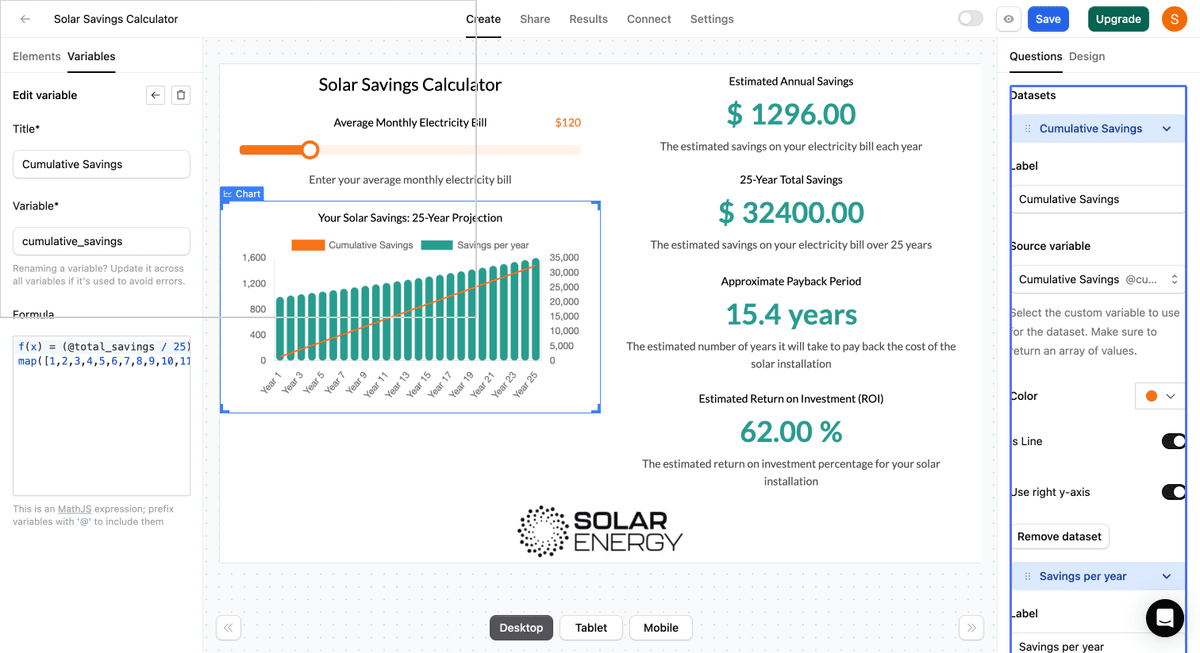
For more information on building dynamic datasets, check out our Solar Savings Calculator template. This template is quite advanced, as the calculations of the datasets overlap. You need results from one dataset to calculate the other.
Example calculator form
To see the Charts question in action, check out the example form we created:
You can find out more about creating a solar savings calculator template here.
Advanced chart settings
The chart types in ActiveCalculator offer several advanced options:
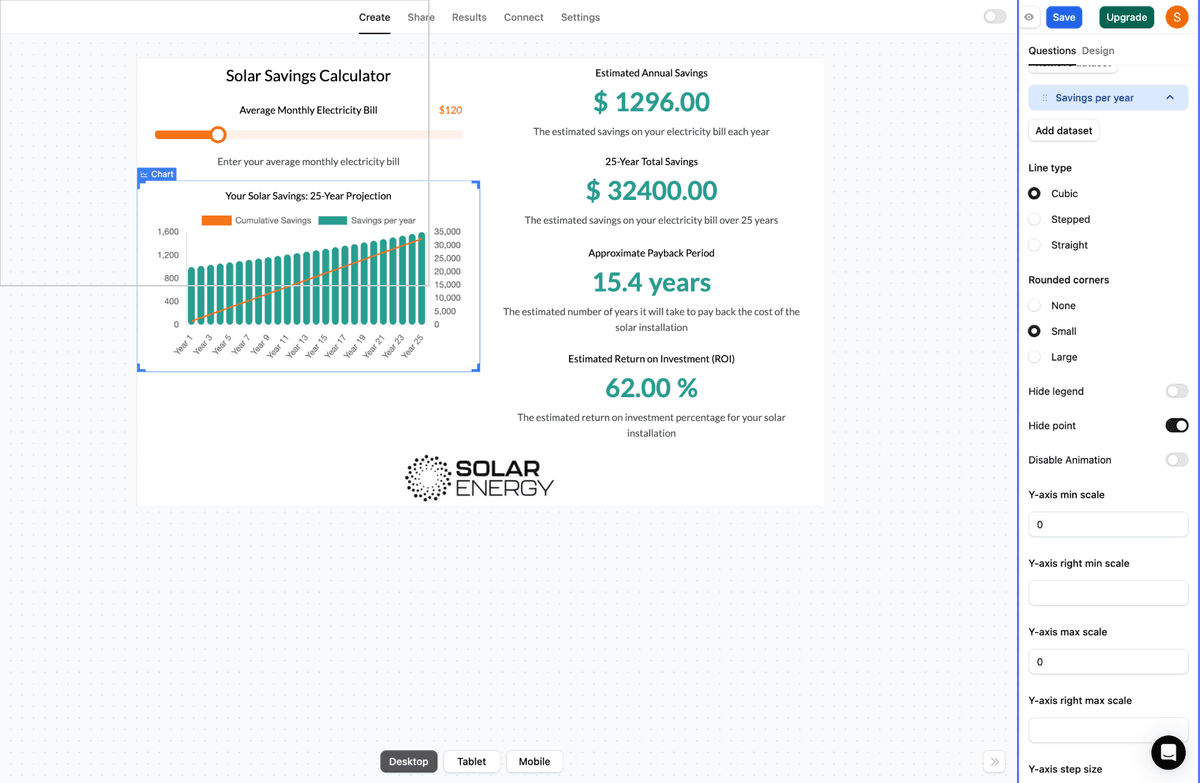
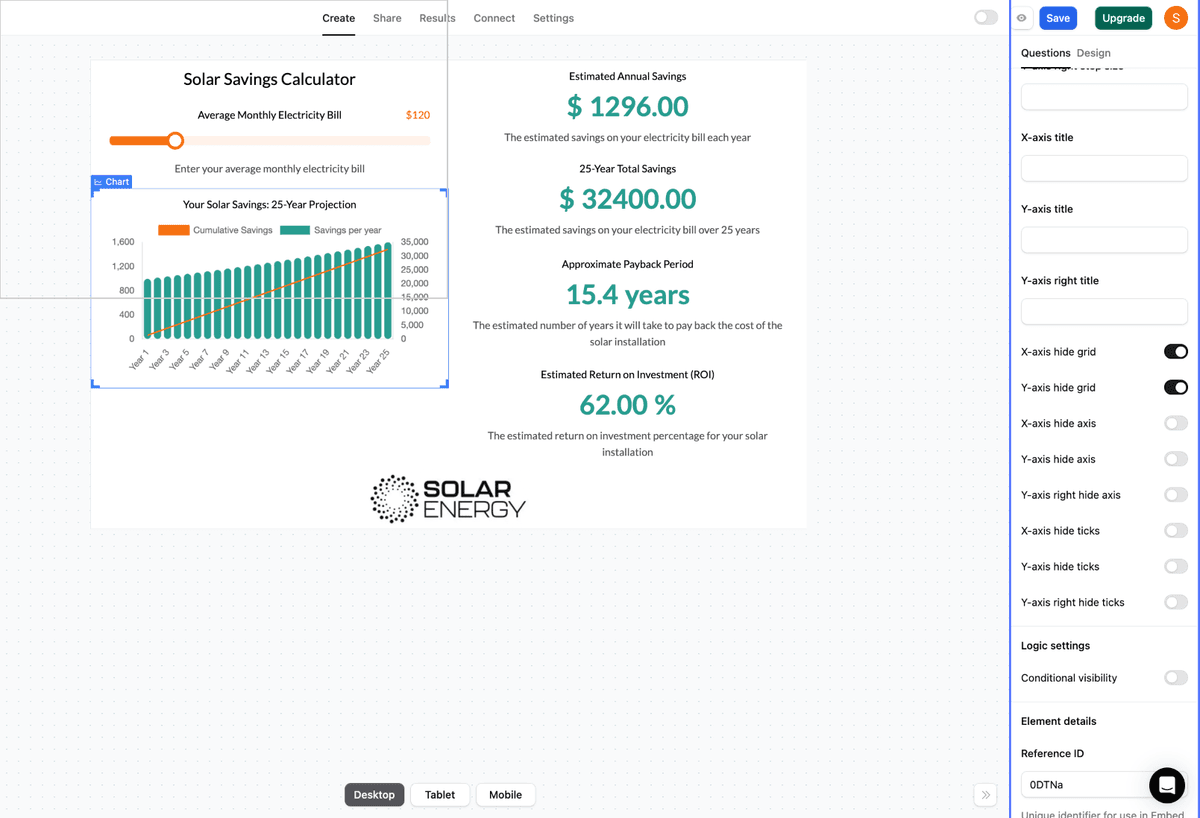
- Line Type: For 'line', 'area', 'bar', and 'stackedBar' charts, you can select the line type from 'Cubic', 'Stepped', or 'Straight'.
- Rounded Corners: For 'bar', 'stackedBar', and 'horizontalBar' charts, you can choose the rounded corner style from 'None', 'Small', and 'Large'.
- Hide Legend: Toggle this option to show or hide the chart legend.
- Hide Point: For 'line', 'area', 'radar', 'bar', and 'stackedBar' charts, you can toggle the hide point option to show or hide data points.
- Y-Axis Min Scale: Set the minimum y-axis scale. The default value is 0.
- Y-Axis Max Scale: Set the maximum y-axis scale. The default value is the highest value in your dataset.
- Y-Axis Step Size: Determine the number of horizontal grid lines. You can decrease or increase the number of grid lines from the default setting.
- X-Axis Title: Add a title for the x-axis.
- Y-Axis Title: Add a title for the y-axis.
- Right Y-Axis Settings: If you enable "Use right y-axis" in the dataset, you can configure settings like min/max scale, step size, axis, ticks, and title for the right y-axis. This is useful when you want to use a different scale for a specific dataset, like in the solar savings example where we use cumulative savings on the right y-axis.
- X-Axis Hide Grid: Toggle this option to show or hide the x-axis grid.
- Y-Axis Hide Grid: Toggle this option to show or hide the y-axis grid.
- X-Axis Hide Axis: Toggle this option to show or hide the x-axis.
- Y-Axis Hide Axis: Toggle this option to show or hide the y-axis.
- X-Axis Hide Ticks: Toggle this option to show or hide the x-axis ticks.
- Y-Axis Hide Ticks: Toggle this option to show or hide the y-axis ticks.
Logic settings - show/hide logic
Toggle this option if you want to control whether the Charts question is shown or hidden under certain circumstances. If the result of the visibility formula is TRUE or a number above 0, the question is visible. If the result is FALSE or 0, it's hidden.
For more information on logic settings and show/hide logic, refer to our help article on conditional visibility of calculator input fields.
Showing stacked bar as multi (clustered stacked bar)
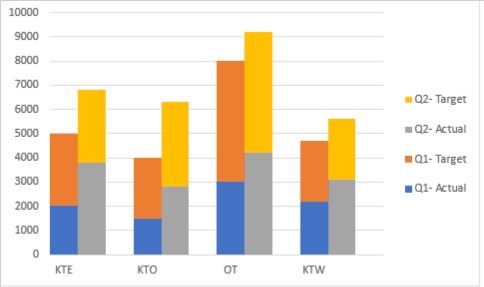
In the Stacked Bar chart type, you can define groups in the dataset options to stack the bar chart. If you use one group for all datasets, they will be stacked together. If you use two or three groups (e.g., group 1, group 2) across four datasets, with two datasets belonging to group 1 and two belonging to group 2, it will create a clustered stacked bar chart.

Integrating charts on other platforms
You can easily integrate or embed ActiveCalculator's powerful charts and graphs on your website platform, even if it doesn't have a strong chart or graph builder. Simply create your chart or graph within ActiveCalculator and embed it onto your platform by copying and pasting a single line of code. Any updates made to your data will be automatically reflected in your embedded charts and graphs.
ActiveCalculator is powerful enough to handle complex datasets and has the functionality to manipulate the data to get the outcomes you need. You can also create dynamic charts for website forms, like mortgage calculators, where the chart changes based on user input. ActiveCalculator supports various user input methods, such as radio buttons, sliders, dropdown lists, and numerical fields.
Troubleshooting and FAQs
Q: How do I clear the placeholder data in a new Charts question? A: Simply delete the pre-filled data in the horizontal axis labels and dataset fields before building your own chart.
Q: Can I use different scales for different datasets? A: Yes, you can enable the "Use right y-axis" option for a specific dataset to display it on a separate scale on the right side of the chart.
Q: How can I create a clustered stacked bar chart? A: In the Stacked Bar chart type, define multiple groups in the dataset options. Assign each dataset to a group, and the chart will display as a clustered stacked bar chart.